IoT Data Visualization Tools with Real-Time Notifications
Asset Tracking software and data visualization tools with a notification dashboard for yard management system, pallet inventory tracking and construction site worker tracking. All you will have are a few Bluetooth asset tracking devices and a secure gateway with our IoT data visualisation platform. The IoT sensor sends measurement data via Bluetooth for standalone applications, which can be integrated to provide alerts and notifications. Our Bluetooth sensor data visualisation tools help visualise IoT data using Bluetooth AoA technology, a Bluetooth gateway, and our cloud software subscription. This ensures constant environmental conditions in applications such as greenhouse monitoring, motor pump monitoring, safety monitoring of medicines and vaccines and wine cellar temperature monitoring. Read FAQ
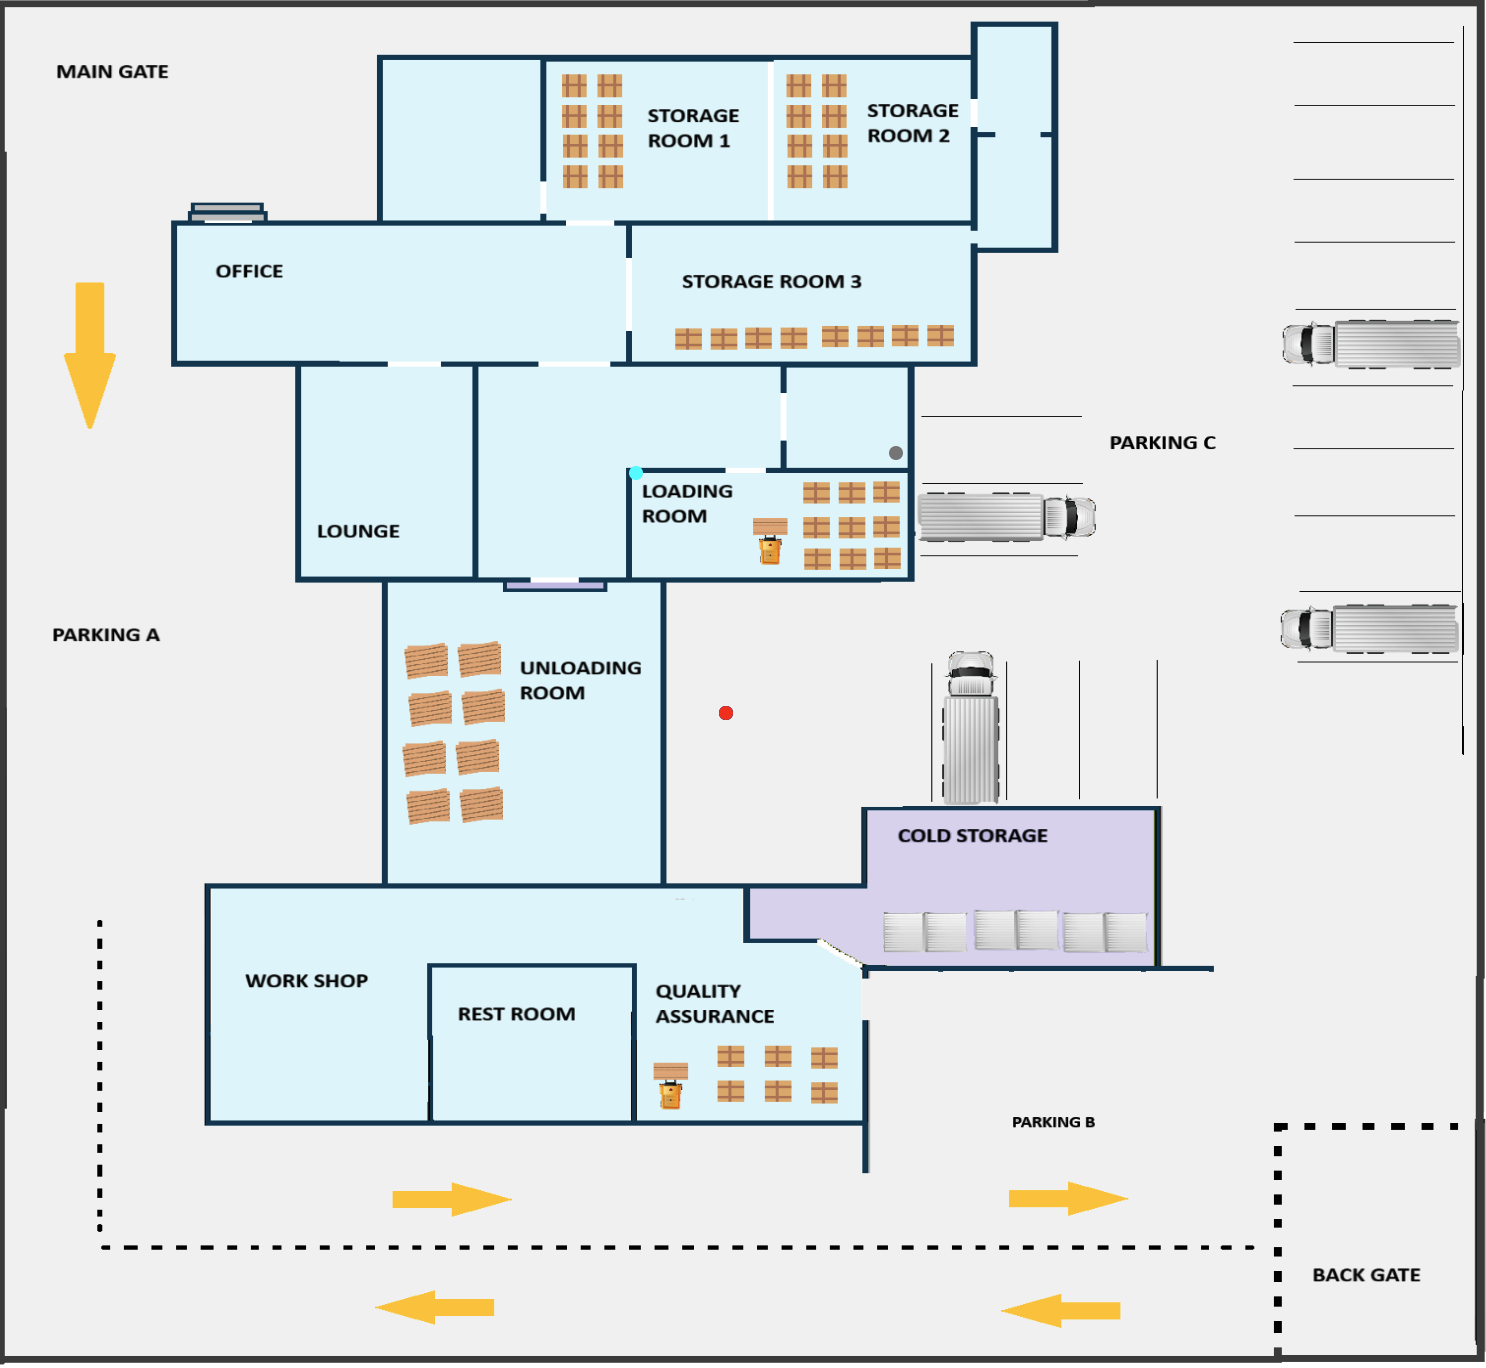
Yard Management and Monitoring Dashboard
Maintaining a fleet logistics yard can be a cumbersome task, considering the range of assets, fixed and moving, that are in the vast logistics yard. Trucks, cargo, Pallets, temporary orkers, drivers, cleaners, operational staff, spares inventory, machinery and other assets. Imagine having a digital twin map which depicts the whole yard on a single screen, showing a range of activities, tracking fixed and moving objects, temperature, humidity, pump motor performance, maintenance routines, tracking of inspections and housekeeping. The power of Digital Twins in yard management.
Digital Twin in Warehouse Management
Inventory management in a warehouse can be another challenging task, when it’s difficult to locate stacked pallets, ensuring the First in First Out method (FIFO), organising physical stocktake, preventing theft of pallet inventory, loss of productivity due to time taken to locate stored goods, weekly cycle counting, worker safety, monitoring safety and cold chain norms. Welcome to the power of the Digital twin in warehouse monitoring.
Bluetooth IoT Data Visualisation Tools and Notification Features
By integrating Bluetooth IoT solutions, it is now possible to deploy indoor monitoring solutions to measure temperature and humidity. You will get all the best features with Bluetooth sensors and the Gateway. The Bluetooth gateway routes the sensors’ data to our software cloud platform, which enables smart device data management to visualise IoT data. RipplesIPS enables remote monitoring via the Internet with trusted email alerts, notifications, and history. With the Bluetooth LoRaWAN network, you will also get a longer Bluetooth range for your shop floor area. We provide easy-to-deploy yard management and digital twins in the manufacturing and warehousing industries.
Digital Twins – IoT Visualisation Platform and Notifications for Greenhouses
IoT data visualisation and notification tools to fertilise your greenhouse plants, water them regularly, and ensure proper conditions in the greenhouse with the help of Bluetooth AoA solutions. With these tips, you will have a rich harvest. Optimising greenhouse conditions is one of the most important things you can do to increase the harvest from your greenhouse plants. When you closely monitor the temperature in your greenhouse through RipplesIPS alerts and notifications, you can already start growing crops in the early spring and collect your harvests well into the autumn using cloud and iot data visualisation and notification dashboard
Bluetooth Sensor Data Visualisation with Notification Dashboard
For the premium wines to mature, they should remain at a temperature of about 12 °C, and at least between 10 °C and 16 °C. If the wine bottles have a traditional cork, the humidity should be somewhere between 65% 75% so that the cork does not dry out and damage the wine, and does not cause the bottle to become mouldy. A shop floor dashboard comes in handy, along with the RTLS platform
To preserve the top-of-the-shelf wine for a long period, you must store it at an optimal temperature and air humidity. If you want to store the wine collection long-term, it’s worth creating a suitable space for the wine bottles. The space should remain at a low temperature, be humid and dark, and have the possibility of storing wine horizontally. A wine cellar is best suited for this task, but for smaller quantities, it is possible to use wine shelves or cabinets. The space should be dark so that sunlight doesn’t spoil the wine’s inherent ageing. This dashboard platform is part of our broader factory shop floor management software, designed for real-time visibility across manufacturing operations.

Asset Tracking Software and data visualisation
IoT data visualisation tools with notification and alerts, with dashboard management on the cloud to monitor temperature, humidity, inventory pallets & worker safety. The best Bluetooth cloud sensor data visualisation tools for implementing the Bluetooth sensor dashboard, which helps in ease of deployment and low maintenance. Easily monitor environmental conditions in greenhouses, vineyards, wine cellars, pharmacies, and vaccine distribution centres.
Contact us for a free demo of IoT monitoring dashboard, which helps in reducing costs and saving lives.